Energy Loop Assessment for Water Cooling Tower
The purpose of this post is to stimulate you to share your experiences and thoughts on energy-related issues.
The following table and related diagrams illustrate how to assess energy in a production plant scenario served by a water cooling tower. It includes three different cases with different criteria and different situations. The numbers shown are strictly EMBLEMATIC for the only purpose of illustrating the cases.
Energy Loop Assessment
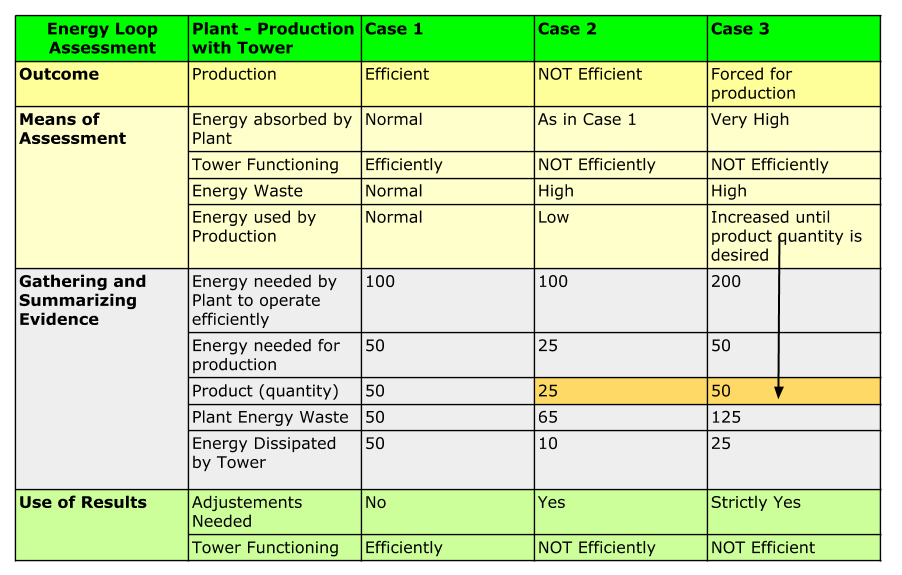 |
| Table for Energy Loop Assessment |
Case 1: Plant – Production with Tower; Outcome : EFFICIENT
 |
| Diagram for Case 1 |
Case 2: Plant – Production with Tower: Outcome : NOT EFFICIENT
 |
| Diagram for Case 2 |
Case 3: Plant – Production with Tower; Outcome: FORCED FOR PRODUCTION
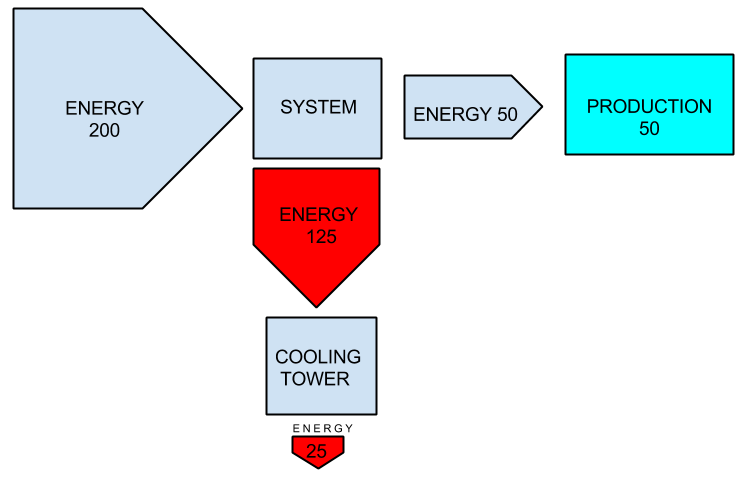 |
| Diagram for Case 3 |